Why the AQI doesn't match your asthma (and an index that does)
US AQI is the highest of six pollutant scores; 'Moderate' hides which one. Breathing Index is a free app that learns which pollutants trigger your asthma.
I had the pleasure of visiting Amsterdam this summer, and I was both very excited (I love a walkable city) but also very nervous, though, since it was August, and I often get an asthma trigger between August and the end of September, depending on the region.
You might find this relatable or odd, but despite my worries, I tried to avoid looking at the AQI. Sometimes looking at it stresses me out and makes me react. But one evening I was walking briskly along the canals and noticed I couldn’t breathe in all the way. It wasn’t hindering me too much, just noticeable. It was the first time I felt my asthma that trip, so I looked at the AQI, and it said “7 Insufficient”. Yup! How refreshing to see 1) an AQI measure that describes what I’m feeling 2) an AQI measure near the top of its range (Dutch LKI range is 1-11) that intuitively matches my sense of unease while breathing.
Contrast that with the US AQI, where I’ve had asthma attacks outdoors at a “Good” AQI of 30, and been completely fine on days with “Unhealthy for sensitive groups” 100+ AQIs.
What does the AQI actually measure, and is it relevant to asthma?
In the US, our AQI is based on the National Ambient Air Quality Standards (NAAQS), which exist thanks to the 1970 amendments to the Clean Air Act (shoutout to the 91st United States Congress).
The design motivation for the standards behind the AQI are broad, and rightly so: air quality affects lots of folks in different ways, and standards like NAAQS should account for them. But accounting for a broad array of health concerns via an index that reduces to a single number means not being particularly useful for a single health concern; CO, NO2, and PM10 aren’t particularly well-linked to causing problems for asthmatics.
| Pollutant | What it is | AQI averaging window | Acute asthma evidence |
|---|---|---|---|
| PM2.5 | Particles under 2.5 µm: smoke, exhaust, secondary aerosols | 24 hr | Strong (epidemiology; wildfire smoke especially) |
| PM10 | Particles under 10 µm: dust, road grit, pollen fragments (includes PM2.5) | 24 hr | Weak |
| O3 | Ground-level ozone, formed from NOx + VOCs in sunlight | 8 hr | Proven in chamber studies; dose scales with exertion |
| NO2 | Nitrogen dioxide, mostly traffic combustion | 1 hr | Modest; mainly amplifies allergen response |
| SO2 | Sulfur dioxide, from sulfur-bearing fuel (coal, ships) | 1 hr | Proven in chamber studies, within minutes |
| CO | Carbon monoxide, incomplete combustion | 8 hr | None (no airway mechanism) |
Agent-compiled table. Averaging windows from EPA; the evidence column summarizes controlled-exposure and emergency-visit studies gathered in September 2026.
How pollutants get translated to guidance
If you aren’t asthmatic, you might not know that the US’s AQI is this unnecessarily high resolution scale that goes from 0 to 500, and is broken down into six disjointed categories, driven by its aforementioned six constituent pollutants.
I’ve always found it frustrating to parse which part of the scale is supposed to be ok for me, and frustrating to see in practice that its rating does not often correlate with how well I can breathe. Turns out there’s a very good reason for that.
| AQI | Category | EPA's guidance |
|---|---|---|
| 0–50 | Good | Little or no risk |
| 51–100 | Moderate | Acceptable; unusually sensitive people may have symptoms |
| 101–150 | Unhealthy for Sensitive Groups | Sensitive groups may have effects; general public unlikely to |
| 151–200 | Unhealthy | Everyone may have effects; sensitive groups more serious |
| 201–300 | Very Unhealthy | Health alert; everyone at increased risk |
| 301–500 | Hazardous | Emergency conditions; everyone affected |
Agent-compiled table. Bands, colors, and guidance text from EPA’s AQI technical assistance document.
How the US AQI is calculated: the highest of six pollutants
The AQI’s number is just the highest value of any of its 6 sub-indexes for these different pollutants. ie if PM2.5 is 100 and that’s the highest score among the 6 pollutants, the AQI is 100. Whether PM10, NO2, O3, SO2, and CO are each 99 or each 0, the AQI will still be 100.
And it’s not great that CO/PM10/NO2 inclusion in the index will gaslight you into thinking you don’t have asthma if you can breathe on a 130 AQI day because PM10 (or any pollutant that doesn’t happen to be a trigger for you) is at 130.
Similarly, it’ll be hard for you to figure out your trigger if it’s often overshadowed by the pollutant that drives the index. For me, that was the case with ozone, which was often overshadowed by PM2.5, so I’d look at the AQI when it was hard to breathe, and think PM2.5 was responsible.
AQI vs. AQHI: how other countries score the same air
Other authorities make different choices in how constituent pollutants change their indices; in Canada, the AQHI is additive and weighted across the three pollutants it measures, and that means that if O3, NO2, and PM2.5 are all at 50, the US AQI calls that “Good”, and the Canadian AQHI rates it as “High”. Here are some other scenarios where various authorities disagree significantly:
| Scenario | US AQI | Canada AQHI | China AQI | UK DAQI | EU EAQI | Netherlands LKI | South Korea CAI |
|---|---|---|---|---|---|---|---|
| PM2.5 35.4 µg/m³ only | 100 Moderate | 2 Low | 51 Good | 3 Low | Moderate | 8 Insufficient | 100 Moderate |
| NO2 100 ppb only | 100 Moderate | 9 High | 94 Good | 3 Low | Extremely Poor | 10 Bad | 143 Unhealthy |
| O3 70 ppb only | 100 Moderate | 4 Moderate | 81 Good | 5 Moderate | Poor | 7 Insufficient | 83 Moderate |
| All three at the US Moderate ceiling | 100 Moderate | 10+ Very High | 94 Good | 5 Moderate | Extremely Poor | 10 Bad | 143 Unhealthy |
| All three at the US Good ceiling (9.0 / 54 ppb / 53 ppb) | 50 Good | 8 High | 55 Good | 4 Moderate | Poor | 7 Insufficient | 88 Moderate |
| PM2.5 75 µg/m³ only (China's Good ceiling) | 164 Unhealthy | 4 Moderate | 100 Good | 10 Very High | Poor | 10 Bad | 250 Unhealthy |
Agent-compiled table. Easily the best evidence of a need for a breathing index, rather than an air quality one. Each row is one day of steady air at the stated concentrations, run through every authority’s published breakpoints. O3 and NO2 converted at 1.96 and 1.88 µg/m³ per ppb. Canada’s AQHI is computed from the Stieb et al. formula; the others take the highest sub-index; South Korea adds 50 when two pollutants are Unhealthy, and the Netherlands adds one point when every pollutant lands in the same class. The LKI uses the class table in RIVM report 2014-0050 (hourly NO2 and O3, 24-hour PM2.5).
Canada’s AQHI looks more sensitive and maybe more useful to asthmatics, but it is in fact a mortality regression which predicts excess daily DEATHS from the pollutants it measures. So two things are frustratingly true: AQI is the best free tool available to asthmatics to understand if they’re going to have a bad time, and AQI is most certainly not designed to help us do that.
So it was very refreshing to see the LKI (the Netherlands equivalent) describe air quality in terms like “Insufficient” instead of “Moderate”.
A Breathing Index: an air quality index built for asthma
It got me thinking: what if, in addition to an Air Quality Index, which I am thankful for but which doesn’t serve my needs, we had a Breathing Index instead? That just told you how easy it was going to be to breathe?
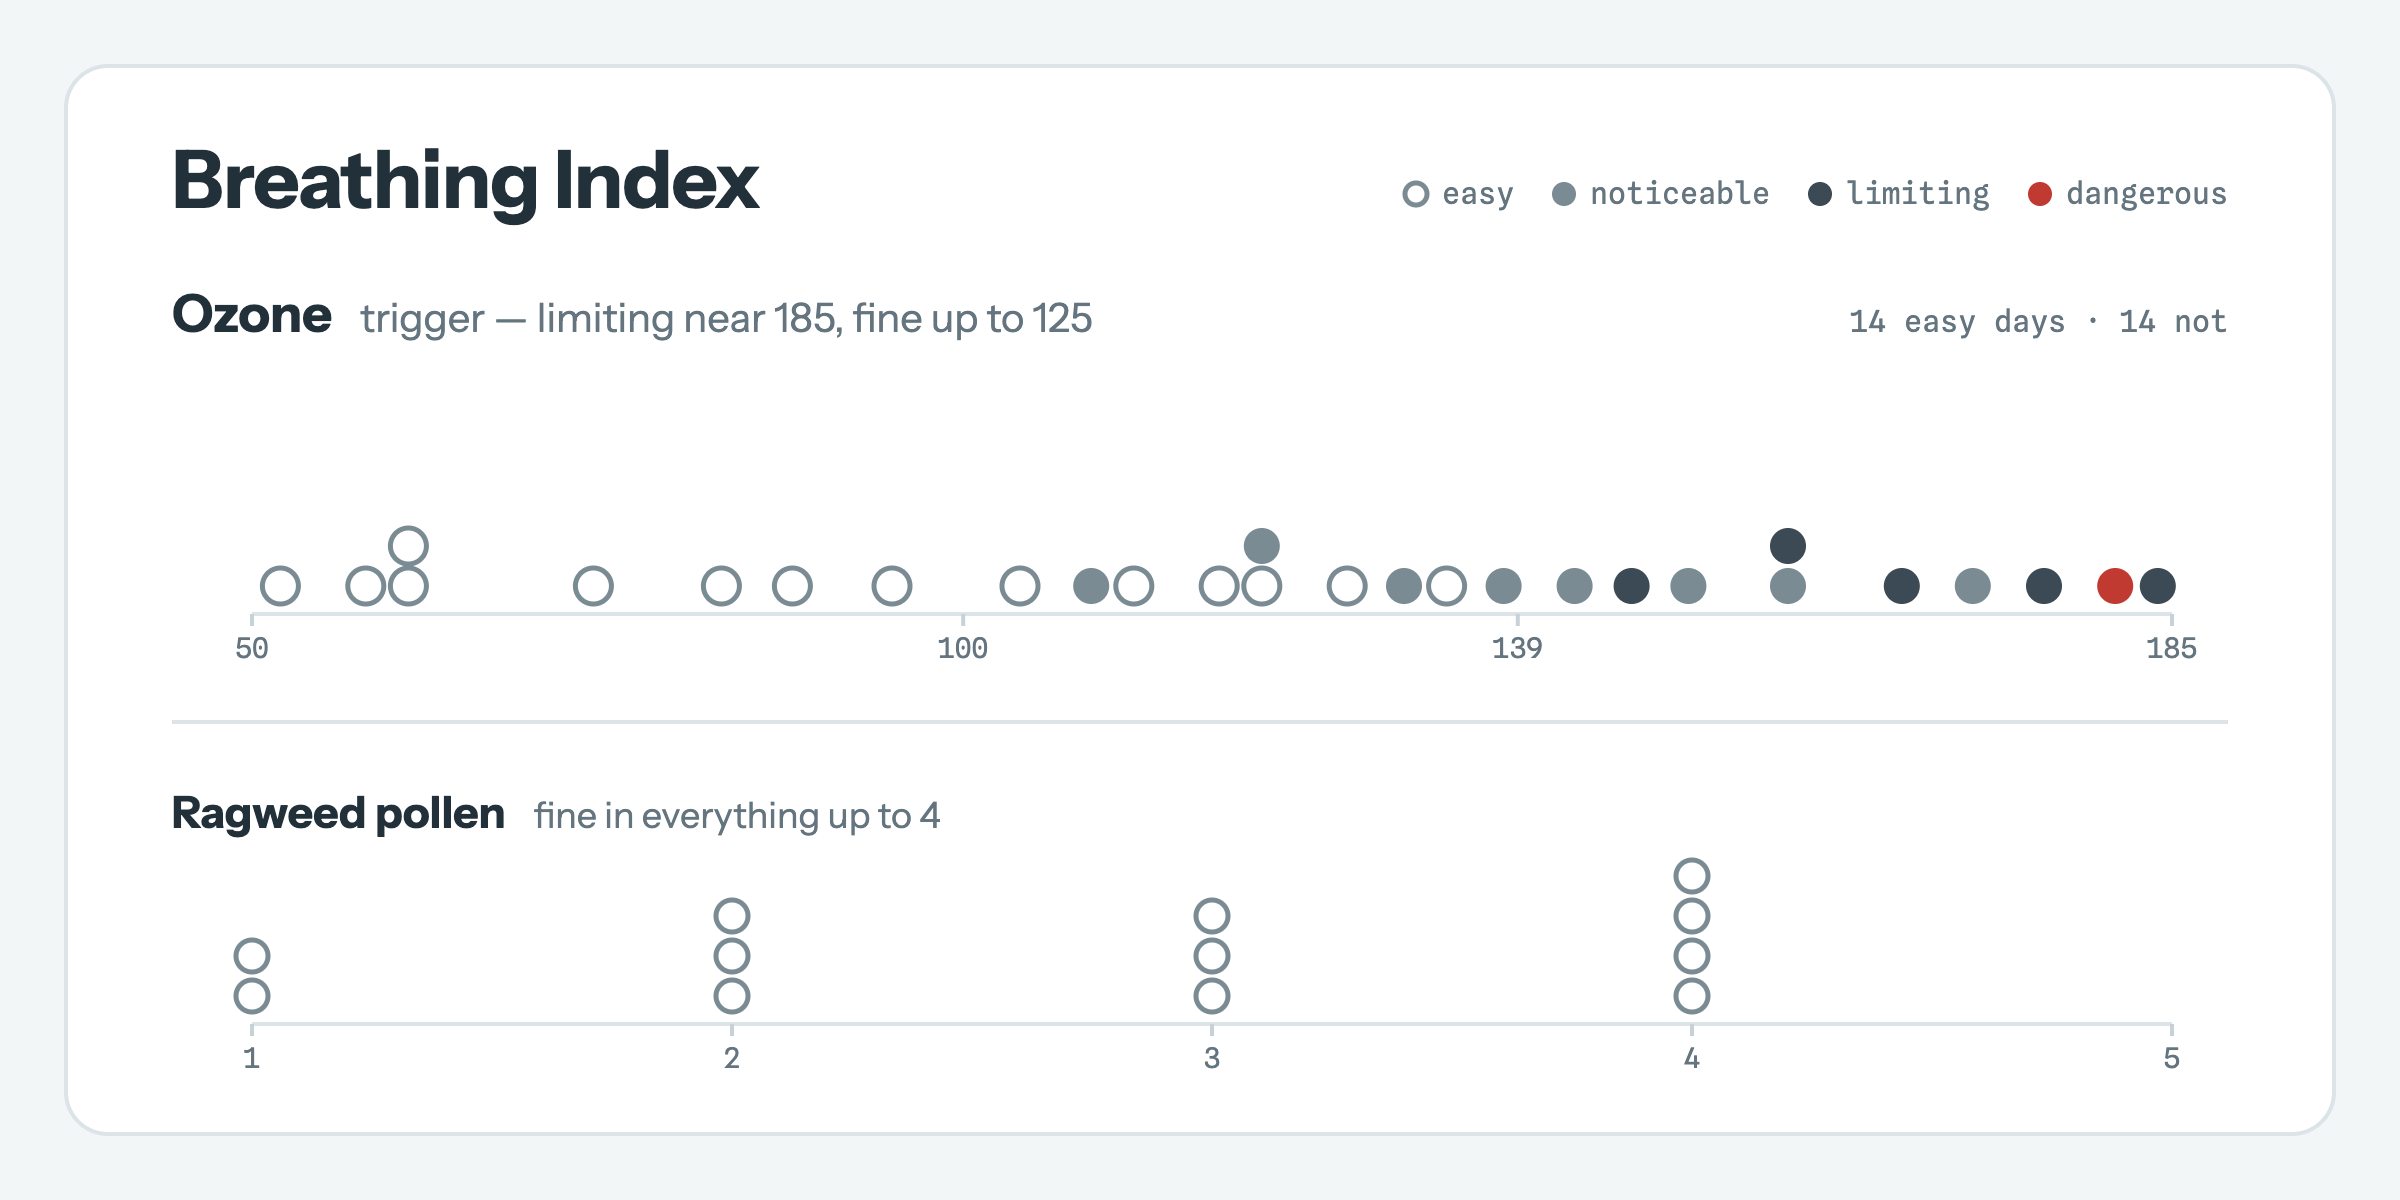
So, I made one! You can find it at breathingindex.com, and it’s free to use! It won’t tell you how easy it is to breathe out of the box because its whole purpose is to build your personal breathing index, and that requires you logging how your breathing feels for a few days. It records your location, captures a vector (aka a list of numbers) of pollutant readings each time you log, and uses that to build your index. Note: your logs don’t leave your own device. There’s no server to speak of; the app is a PWA that runs entirely from your phone or browser. I’ll eventually add paid accounts that’ll let you opt into storing your info in a database, but I’m committed to keeping a version that is free, local, and very useful.
I’ve been using it for over a month, and I’ve learned two things very quickly:
- Ragweed probably isn’t a trigger for me! In the past I’ve had a mysterious asthma trigger that didn’t show up very clearly on AQI measures, and ragweed was my best guess for its source. But I’ve logged easy breathing on days with a very high ragweed index.
- Ozone is a much bigger problem for me than the other AQI pollutants; nearly every “Limiting” log from me involves high ozone.
As for the mysterious late September asthma trigger, I’m hoping it doesn’t happen this year, TBH. But if it does, I will be logging it, and if there’s not an explanation in the logs, you can bet I’ll be looking for more data for my benefit and yours.